はじめに
DreamHanksのMOONです。
前回は「Material CalendarView」というライブラリについて説明しました。
35. 【Android/Kotlin】Material CalendarView
今回は「MpAndroidChart」というライブラリの円グラフについて説明していきます。
MpAndroidChartとは
円グラフや棒グラフなどのグラフを簡単に作ることができるような機能を提供するライブラリです。

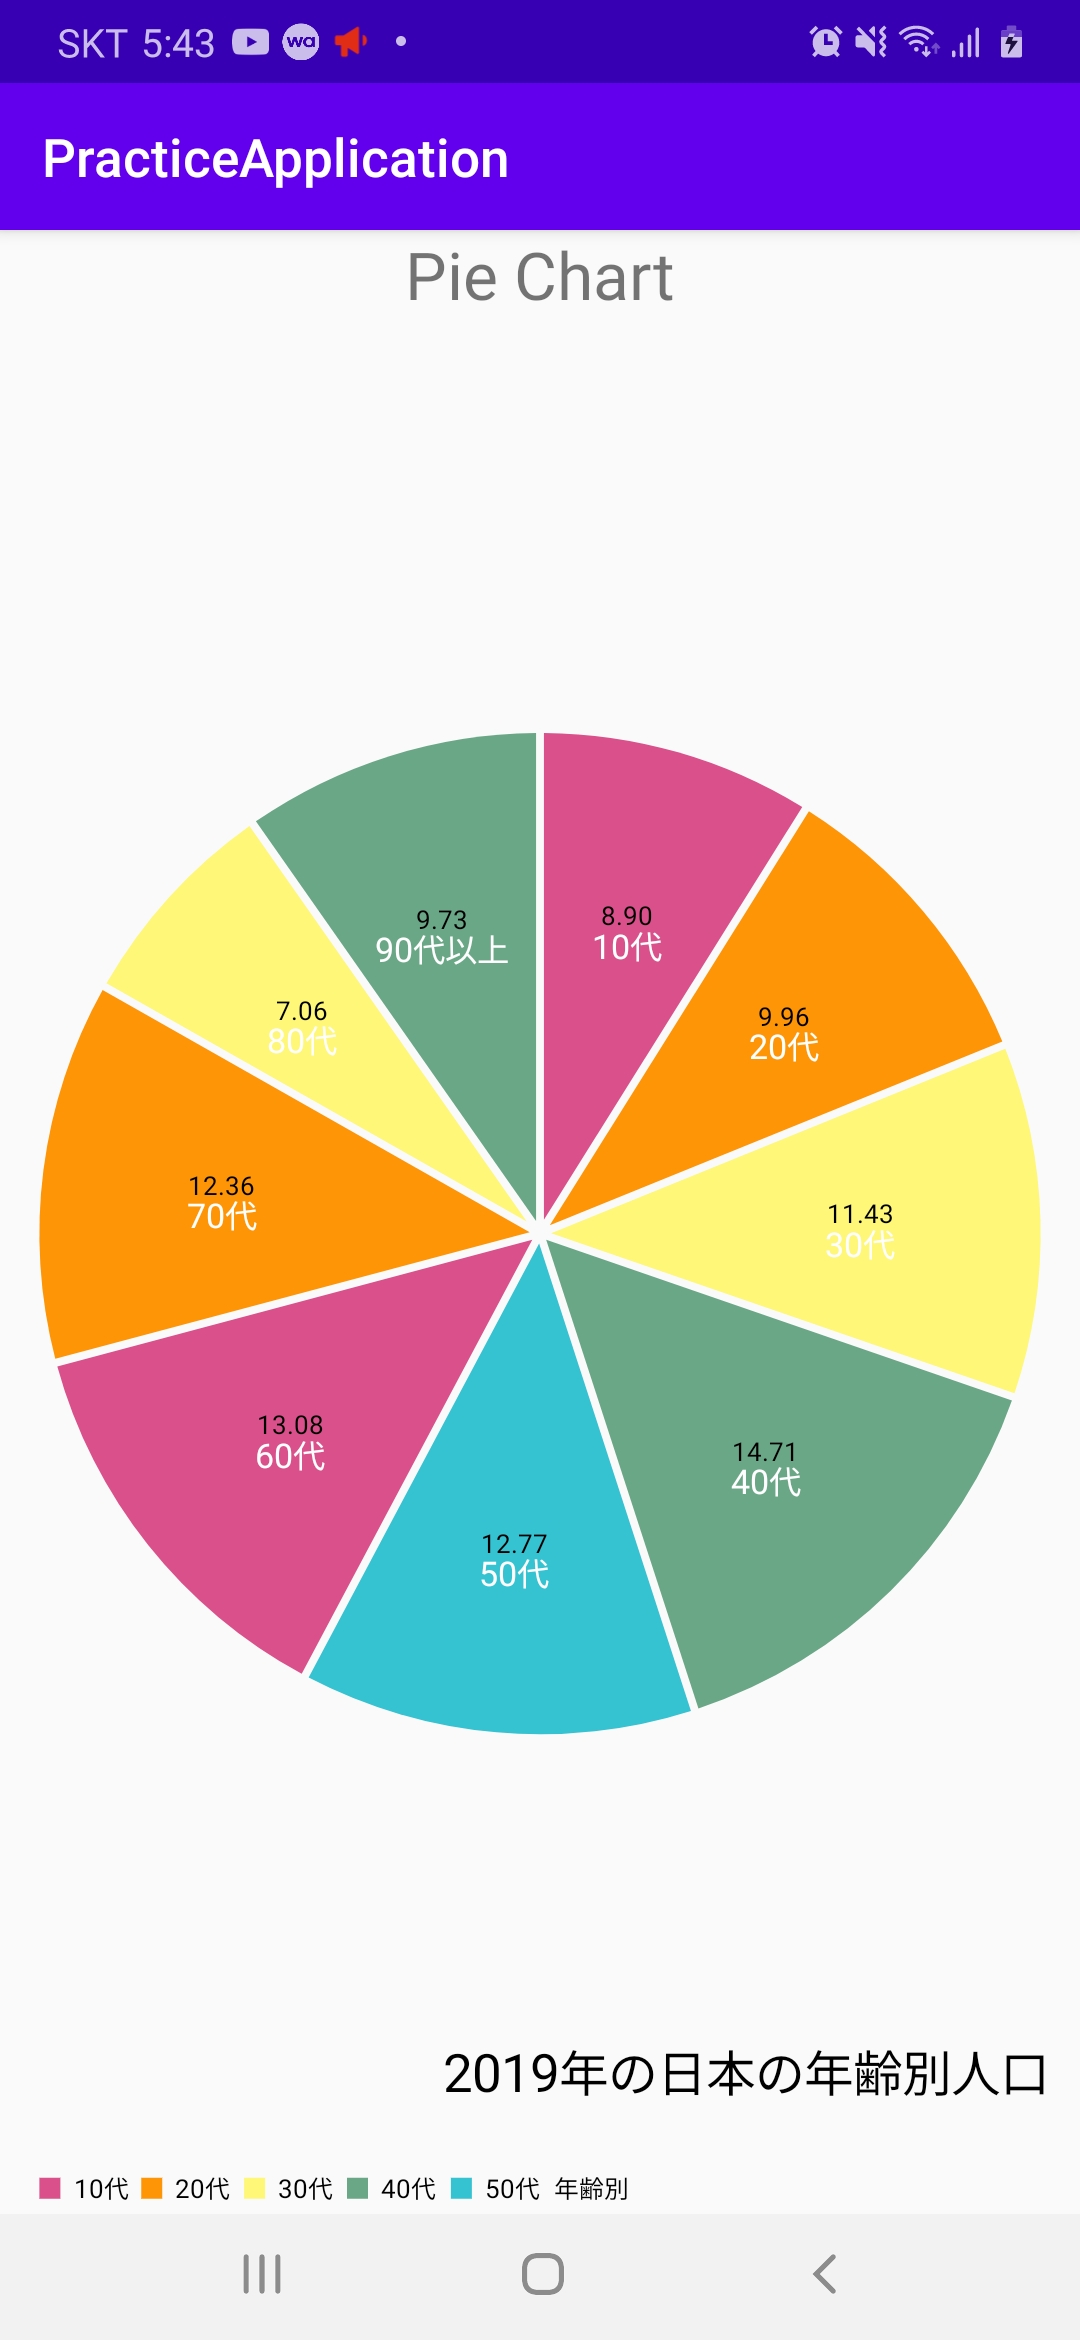
今回はこのライブラリの「Pie Chart」という円グラフを使って去年の年齢別の人口について表示していきます。
設定事項
・Gradleに「MpAndroidChart」のライブラリを追加
・Activity、レイアウトのxmlを設定
Gradleに「MpAndroidChart」のライブラリを追加
「build.gradle」のandroidに下記のコードを追加
|
1 2 3 |
repositories{ maven {url "https://jitpack.io"} } |
「build.gradle」のdependenciesに下記のコードを追加
|
1 |
implementation 'com.github.PhilJay:MpAndroidChart:v3.0.2' |
Activity、レイアウトのxmlを設定
PieChartActivity.kt
|
1 2 3 4 5 6 7 8 9 10 11 12 13 14 15 16 17 18 19 20 21 22 23 24 25 26 27 28 29 30 31 32 33 34 35 36 37 38 39 40 41 42 43 44 45 46 47 48 49 50 51 52 53 54 55 56 57 58 59 60 61 62 63 64 65 |
package com.example.practiceapplication import android.graphics.Color import android.os.Bundle import androidx.appcompat.app.AppCompatActivity import com.github.mikephil.charting.animation.Easing import com.github.mikephil.charting.charts.PieChart import com.github.mikephil.charting.components.Description import com.github.mikephil.charting.data.PieData import com.github.mikephil.charting.data.PieDataSet import com.github.mikephil.charting.data.PieEntry import com.github.mikephil.charting.utils.ColorTemplate class PieChartActivity : AppCompatActivity() { override fun onCreate(savedInstanceState: Bundle?) { super.onCreate(savedInstanceState) setContentView(R.layout.activity_piechart) val pieChart = findViewById<PieChart>(R.id.piechart) pieChart.setUsePercentValues(true) pieChart.getDescription().setEnabled(false) pieChart.setExtraOffsets(5f, 10f, 5f, 5f) pieChart.setDragDecelerationFrictionCoef(0.95f) pieChart.setDrawHoleEnabled(false) pieChart.setHoleColor(Color.BLACK) pieChart.setTransparentCircleRadius(61f) val yValues = ArrayList<PieEntry>() yValues.add(PieEntry(8.9f, "10代")) yValues.add(PieEntry(9.96f, "20代")) yValues.add(PieEntry(11.43f, "30代")) yValues.add(PieEntry(14.71f, "40代")) yValues.add(PieEntry(12.77f, "50代")) yValues.add(PieEntry(13.08f, "60代")) yValues.add(PieEntry(12.36f, "70代")) yValues.add(PieEntry(7.06f, "80代")) yValues.add(PieEntry(9.73f, "90代以上")) val description = Description() description.setText("2019年の日本の年齢別人口") description.setTextSize(20f) pieChart.setDescription(description) pieChart.animateY(1000, Easing.EasingOption.EaseInOutCubic) val dataSet = PieDataSet(yValues, "年齢別") dataSet.sliceSpace = 3f dataSet.selectionShift = 5f dataSet.setColors(*ColorTemplate.JOYFUL_COLORS) val data = PieData(dataSet) data.setValueTextSize(10f) data.setValueTextColor(Color.BLACK) pieChart.setData(data) } } |
activity_piechart.xml
|
1 2 3 4 5 6 7 8 9 10 11 12 13 14 15 16 17 18 19 20 21 22 |
<?xml version="1.0" encoding="utf-8"?> <LinearLayout xmlns:android="http://schemas.android.com/apk/res/android" xmlns:app="http://schemas.android.com/apk/res-auto" xmlns:tools="http://schemas.android.com/tools" android:layout_width="match_parent" android:layout_height="match_parent" android:orientation="vertical" tools:context=".PieChartActivity" android:gravity="center"> <TextView android:layout_width="wrap_content" android:layout_height="wrap_content" android:textSize="25dp" android:text="Pie Chart" /> <com.github.mikephil.charting.charts.PieChart android:layout_width="match_parent" android:layout_height="match_parent" android:id="@+id/piechart" /> </LinearLayout> |
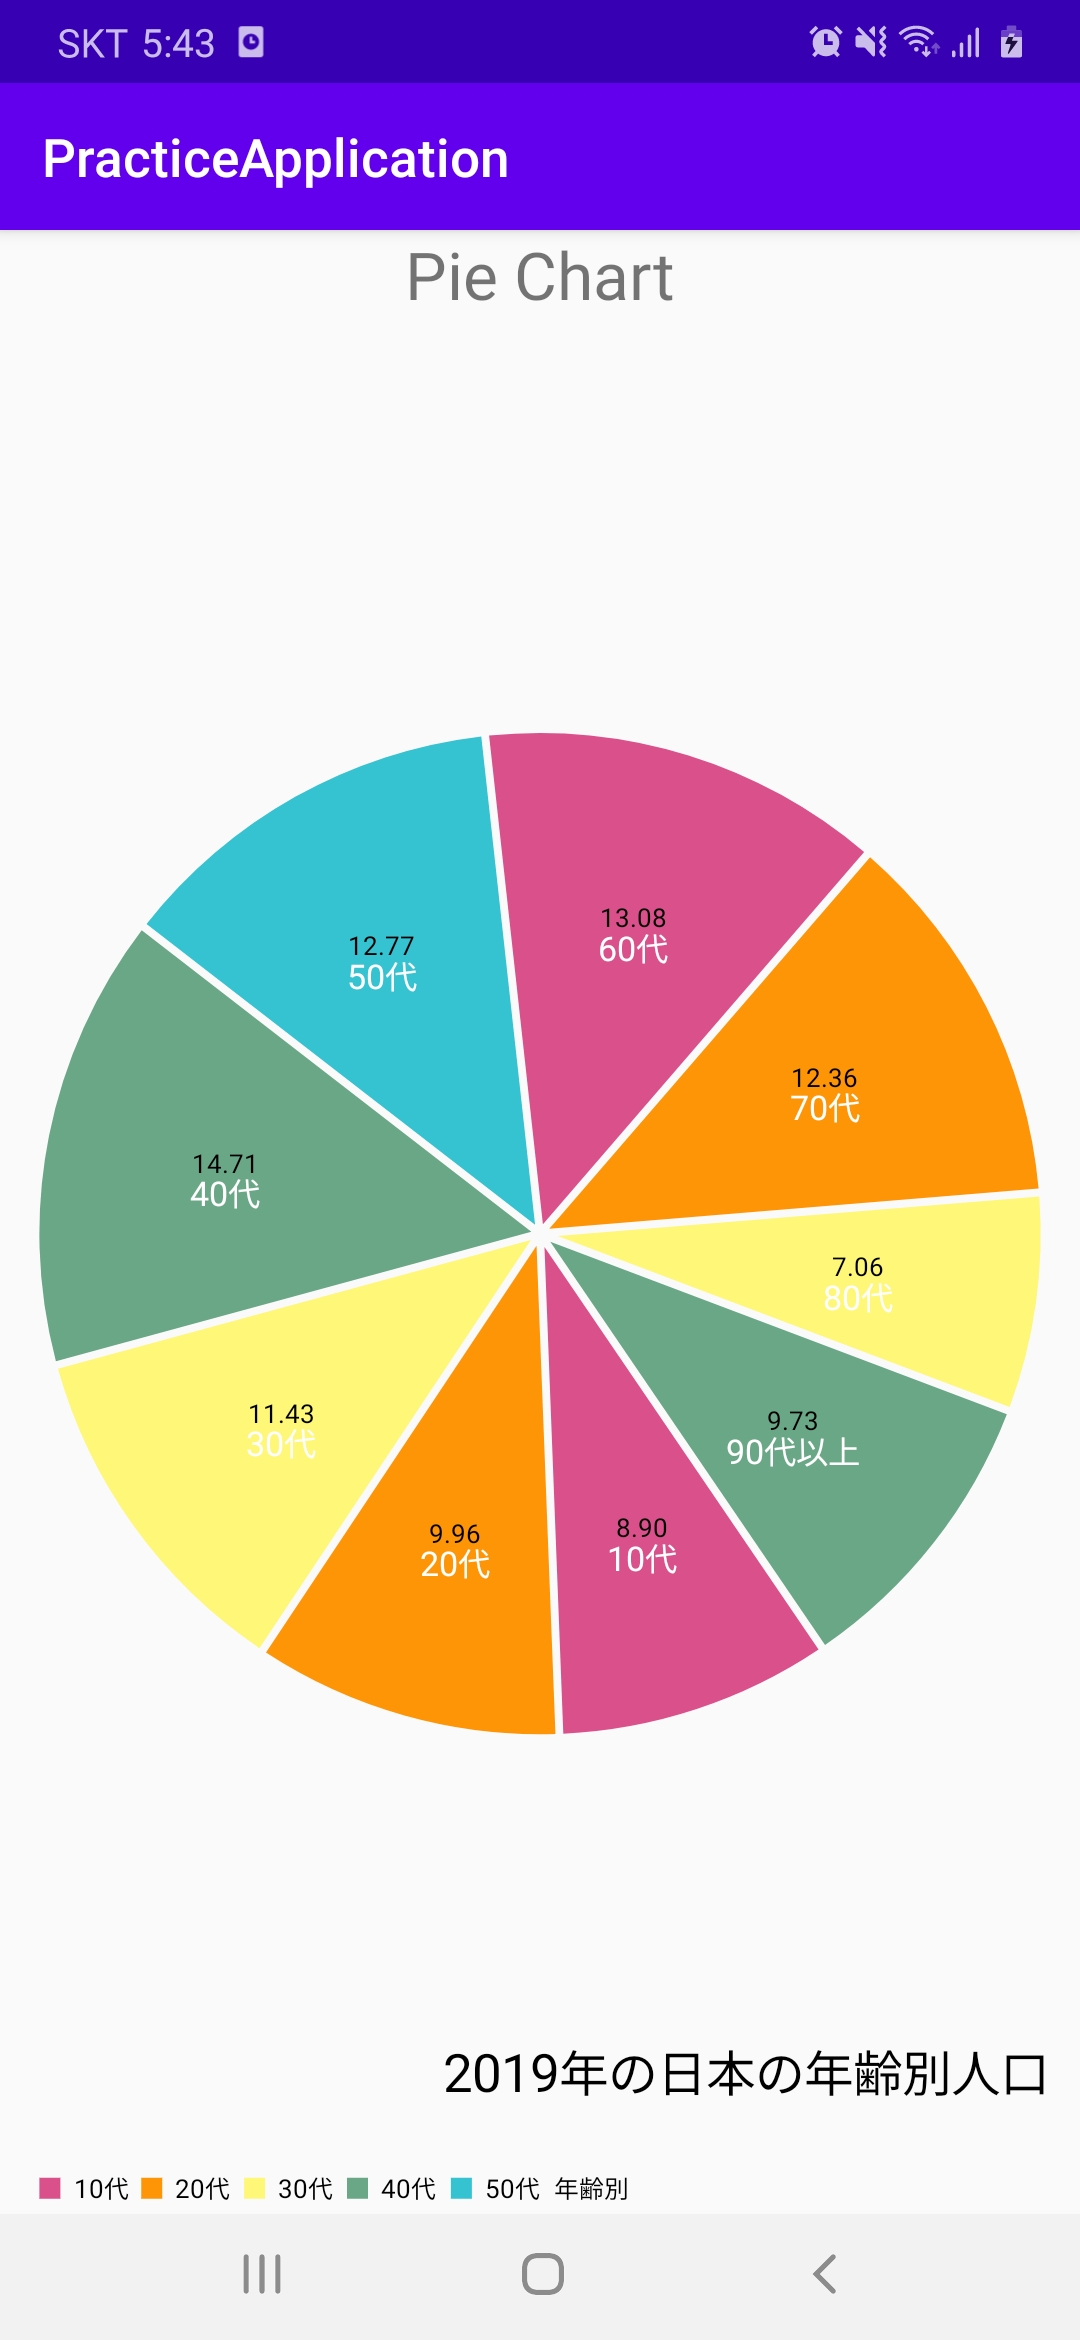
アプリ起動
・初期の画面

・円グラフを回した場合

終わりに
今回は「MpAndroidChart」というライブラリの円グラフについて説明しました。
次回はそのライブラリの折れ線グラフについて説明していきます。


コメント