はじめに
DreamHanksのMOONです。
前回は「MpAndroidChart」というライブラリの円グラフについて説明しました。
36. 【Android/Kotlin】円グラフ(Pie Chart)
今回はそのライブラリの折れ線グラフについて説明していきます。
設定事項
・Gradleに「MpAndroidChart」のライブラリを追加
・Activity、レイアウトのxmlを設定
Gradleに「MpAndroidChart」のライブラリを追加
「build.gradle」のandroidに下記のコードを追加
|
1 2 3 |
repositories{ maven {url "https://jitpack.io"} } |
「build.gradle」のdependenciesに下記のコードを追加
|
1 |
implementation 'com.github.PhilJay:MpAndroidChart:v3.0.2' |
Activity、レイアウトのxmlを設定
LineChartActivity.kt
|
1 2 3 4 5 6 7 8 9 10 11 12 13 14 15 16 17 18 19 20 21 22 23 24 25 26 27 28 29 30 31 32 33 34 35 36 37 38 39 40 41 |
package com.example.practiceapplication import android.os.Bundle import androidx.appcompat.app.AppCompatActivity import com.github.mikephil.charting.charts.LineChart import com.github.mikephil.charting.data.Entry import com.github.mikephil.charting.data.LineData import com.github.mikephil.charting.data.LineDataSet import com.github.mikephil.charting.utils.ColorTemplate class LineChartActivity : AppCompatActivity() { override fun onCreate(savedInstanceState: Bundle?) { super.onCreate(savedInstanceState) setContentView(R.layout.activity_linechart) val lineChart = findViewById<LineChart>(R.id.linechart) val entries: ArrayList<Entry> = ArrayList() entries.add(Entry(4f, 0f)) entries.add(Entry(8f, 1f)) entries.add(Entry(6f, 2f)) entries.add(Entry(2f, 3f)) entries.add(Entry(18f, 4f)) entries.add(Entry(9f, 5f)) entries.add(Entry(16f, 6f)) entries.add(Entry(5f, 7f)) entries.add(Entry(3f, 8f)) entries.add(Entry(7f, 10f)) entries.add(Entry(9f, 11f)) val dataset = LineDataSet(entries, "# of Calls") val data = LineData(dataset) dataset.setColors(*ColorTemplate.COLORFUL_COLORS) // lineChart.data = data lineChart.animateY(5000) } } |
activity_linechart.xml
|
1 2 3 4 5 6 7 8 9 10 11 12 13 14 15 16 17 18 19 20 21 22 |
<?xml version="1.0" encoding="utf-8"?> <LinearLayout xmlns:android="http://schemas.android.com/apk/res/android" xmlns:app="http://schemas.android.com/apk/res-auto" xmlns:tools="http://schemas.android.com/tools" android:layout_width="match_parent" android:layout_height="match_parent" android:orientation="vertical" tools:context=".PieChartActivity" android:gravity="center"> <TextView android:layout_width="wrap_content" android:layout_height="wrap_content" android:textSize="25dp" android:text="Line Chart" /> <com.github.mikephil.charting.charts.LineChart android:id="@+id/linechart" android:layout_width="match_parent" android:layout_height="match_parent"/> </LinearLayout> |
アプリ起動
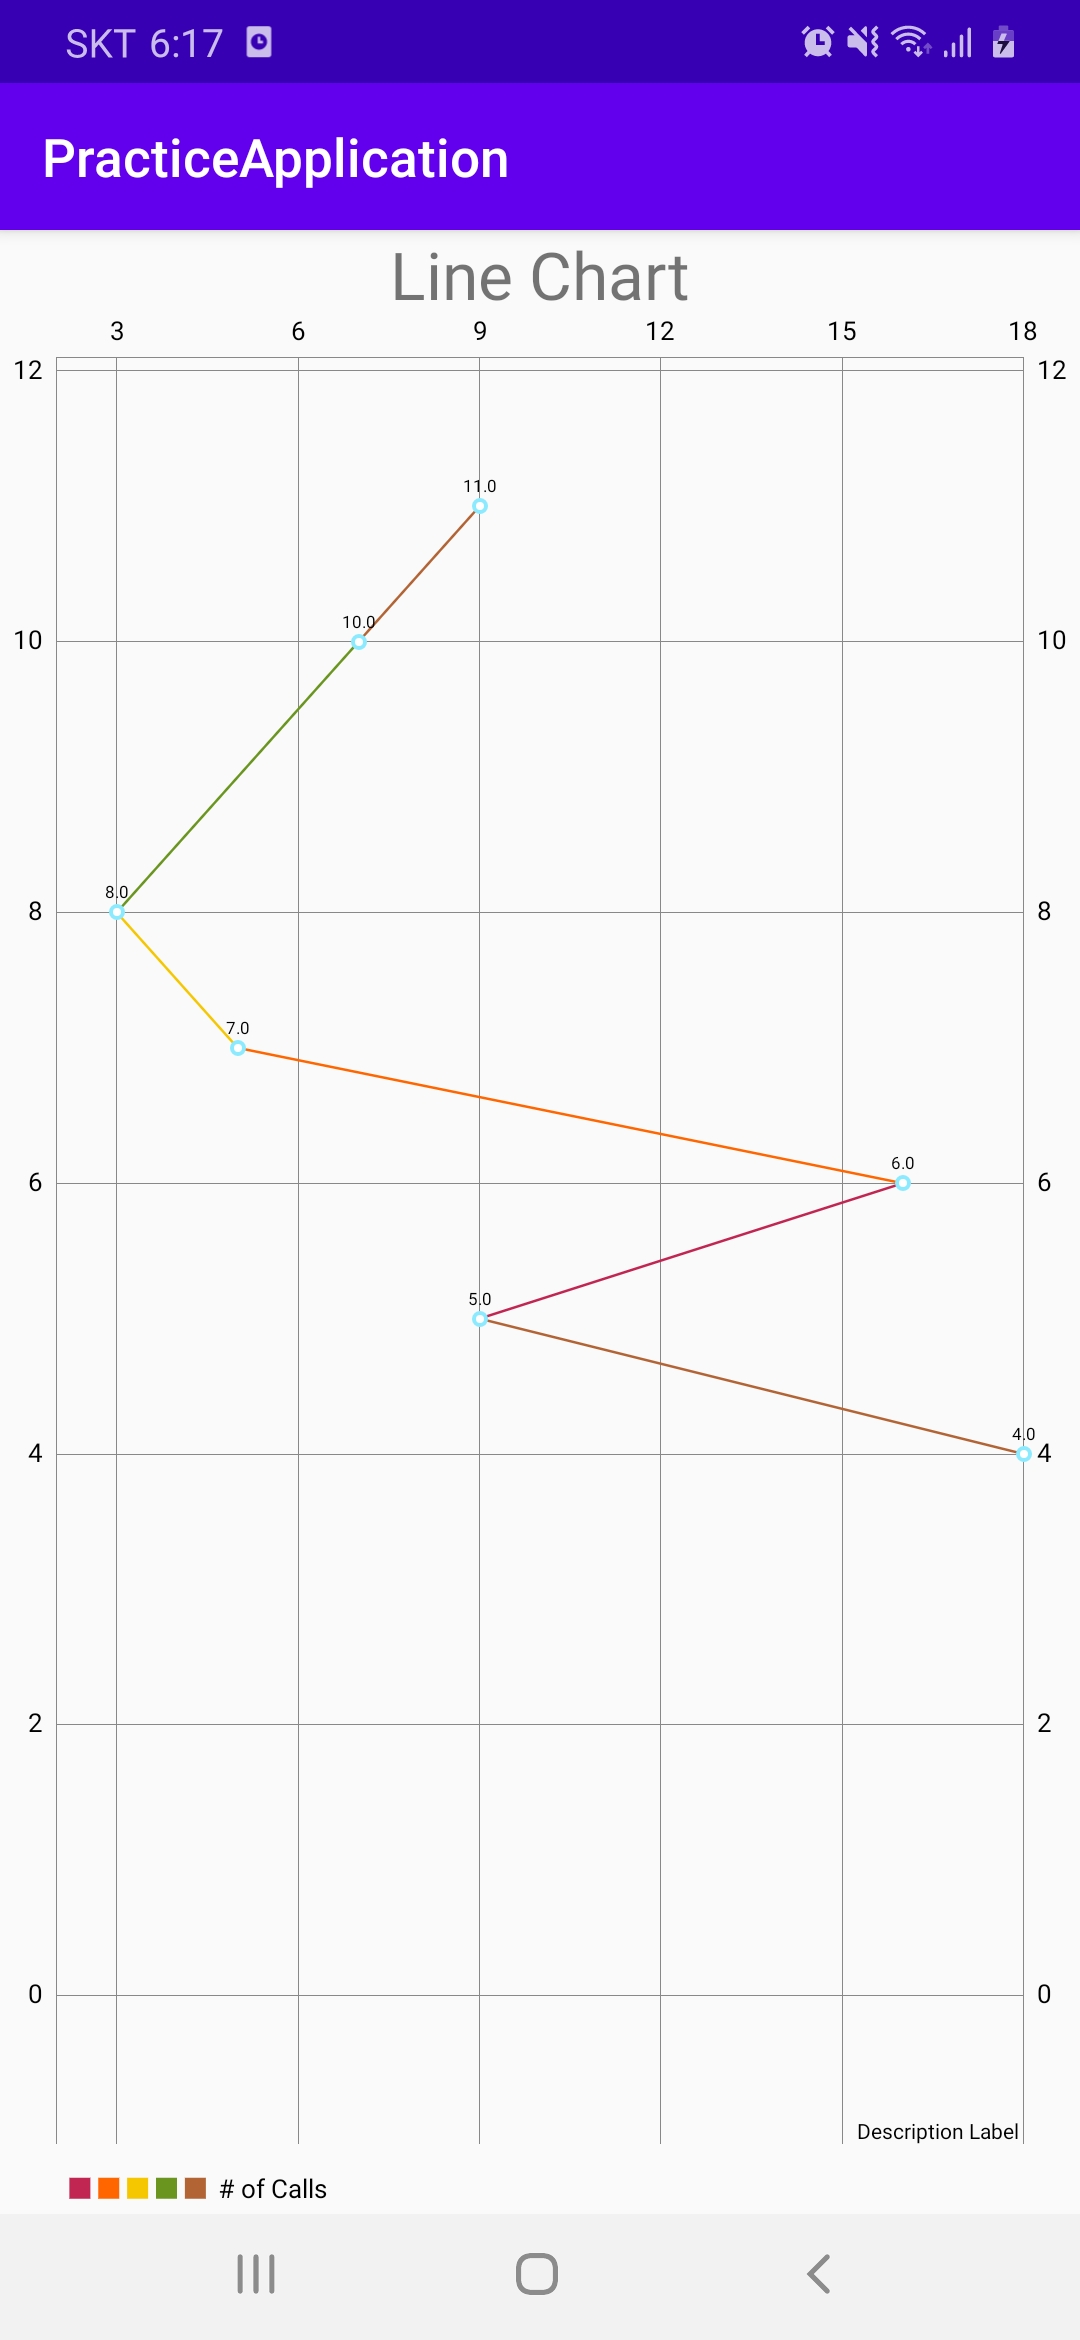
・初期の画面

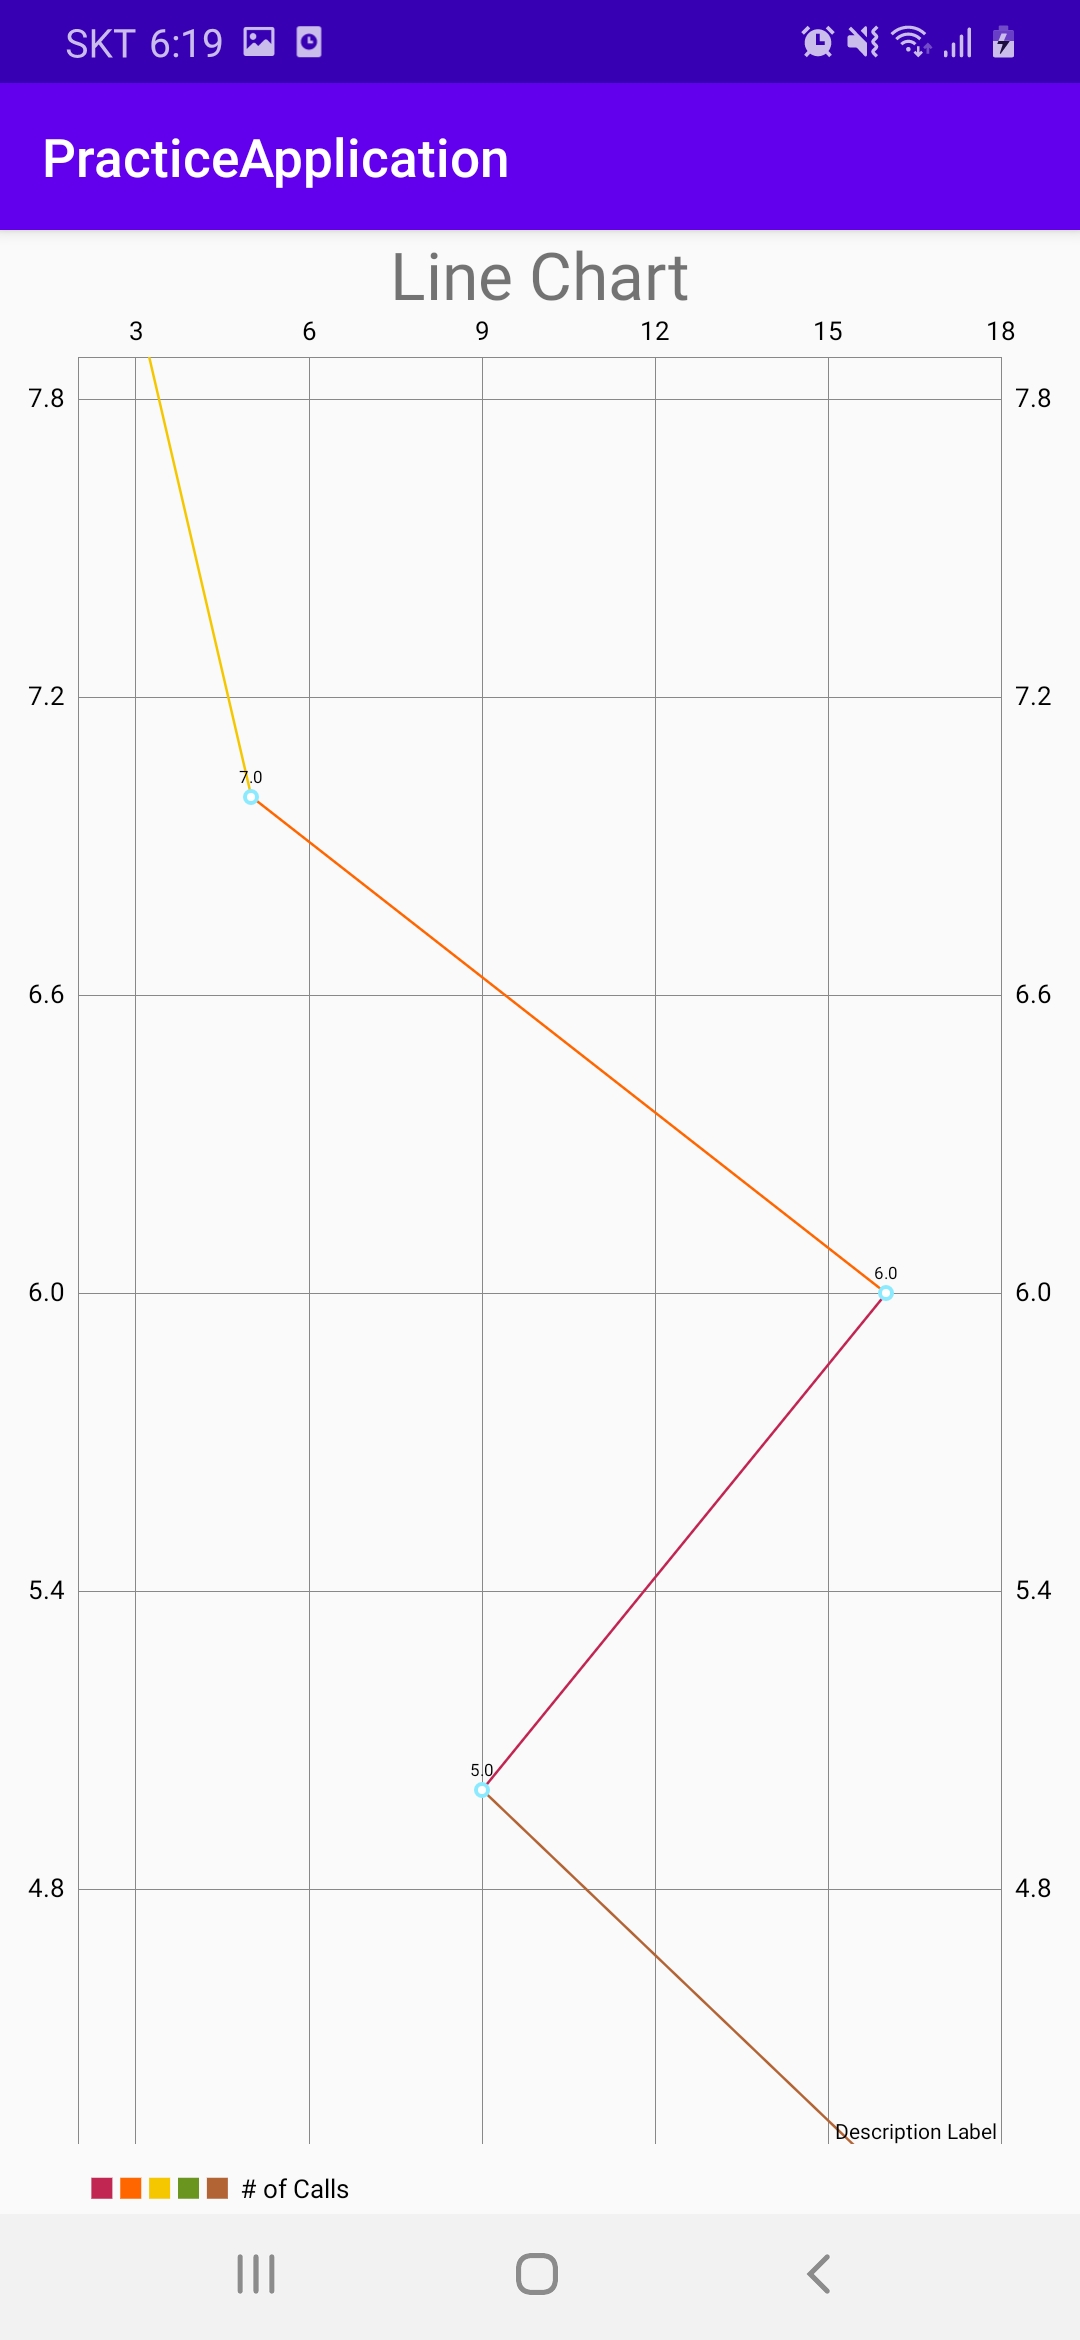
・y軸に拡大した場合

終わりに
今回は折れ線グラフについて説明しました。
次回はそのライブラリの棒グラフについて説明していきます。


コメント